SNAPSHOT OF CURRENT MARKET CONDITIONS FOR SUSSEX COUNTY
(as of 3/31/2021—based on sales of single-family detached homes)
Total Single Family Homes on the Market as of 3/31/2021…646
Down 1% from last month
Homes listed in March 2021…505 (73% already under contract)
Inventory Breakdown: Resale Homes – 54% New Const. – 46%
Total Single Family Homes Sold Current Year……. 995
Total Single Family Homes Sold Previous Year……877
% Change in Homes Sold UP 13%
Average Price of Homes Sold Current Year $494,189
Average Price of Homes Sold Previous Year $411,567
% Change in Average Price UP 20%
Median Price of Homes Sold Current Year $362,490
Median Price of Homes Sold Previous Year $320,000
% Change in Median Price UP 13%
Average Days on Market of Homes Sold Current Year…… 57
Average Days on Market of Homes Sold Previous Year….. 89
% Change in Average Days on Market DOWN 36%
As of the end of March, there were a total of 646 homes on the market, a decrease of 1% from the previous month’s end inventory of 650. This represents slightly less than a 2-month’s supply of inventory, with a current absorption rate of 332 homes sold per month thus far in 2021. There were 505 new listings of single family homes put on the market in March, with 73% of them going under contract by the month’s end. Of the 646 homes on the market at month’s end, 54% of them are new construction homes.
Closed Sales
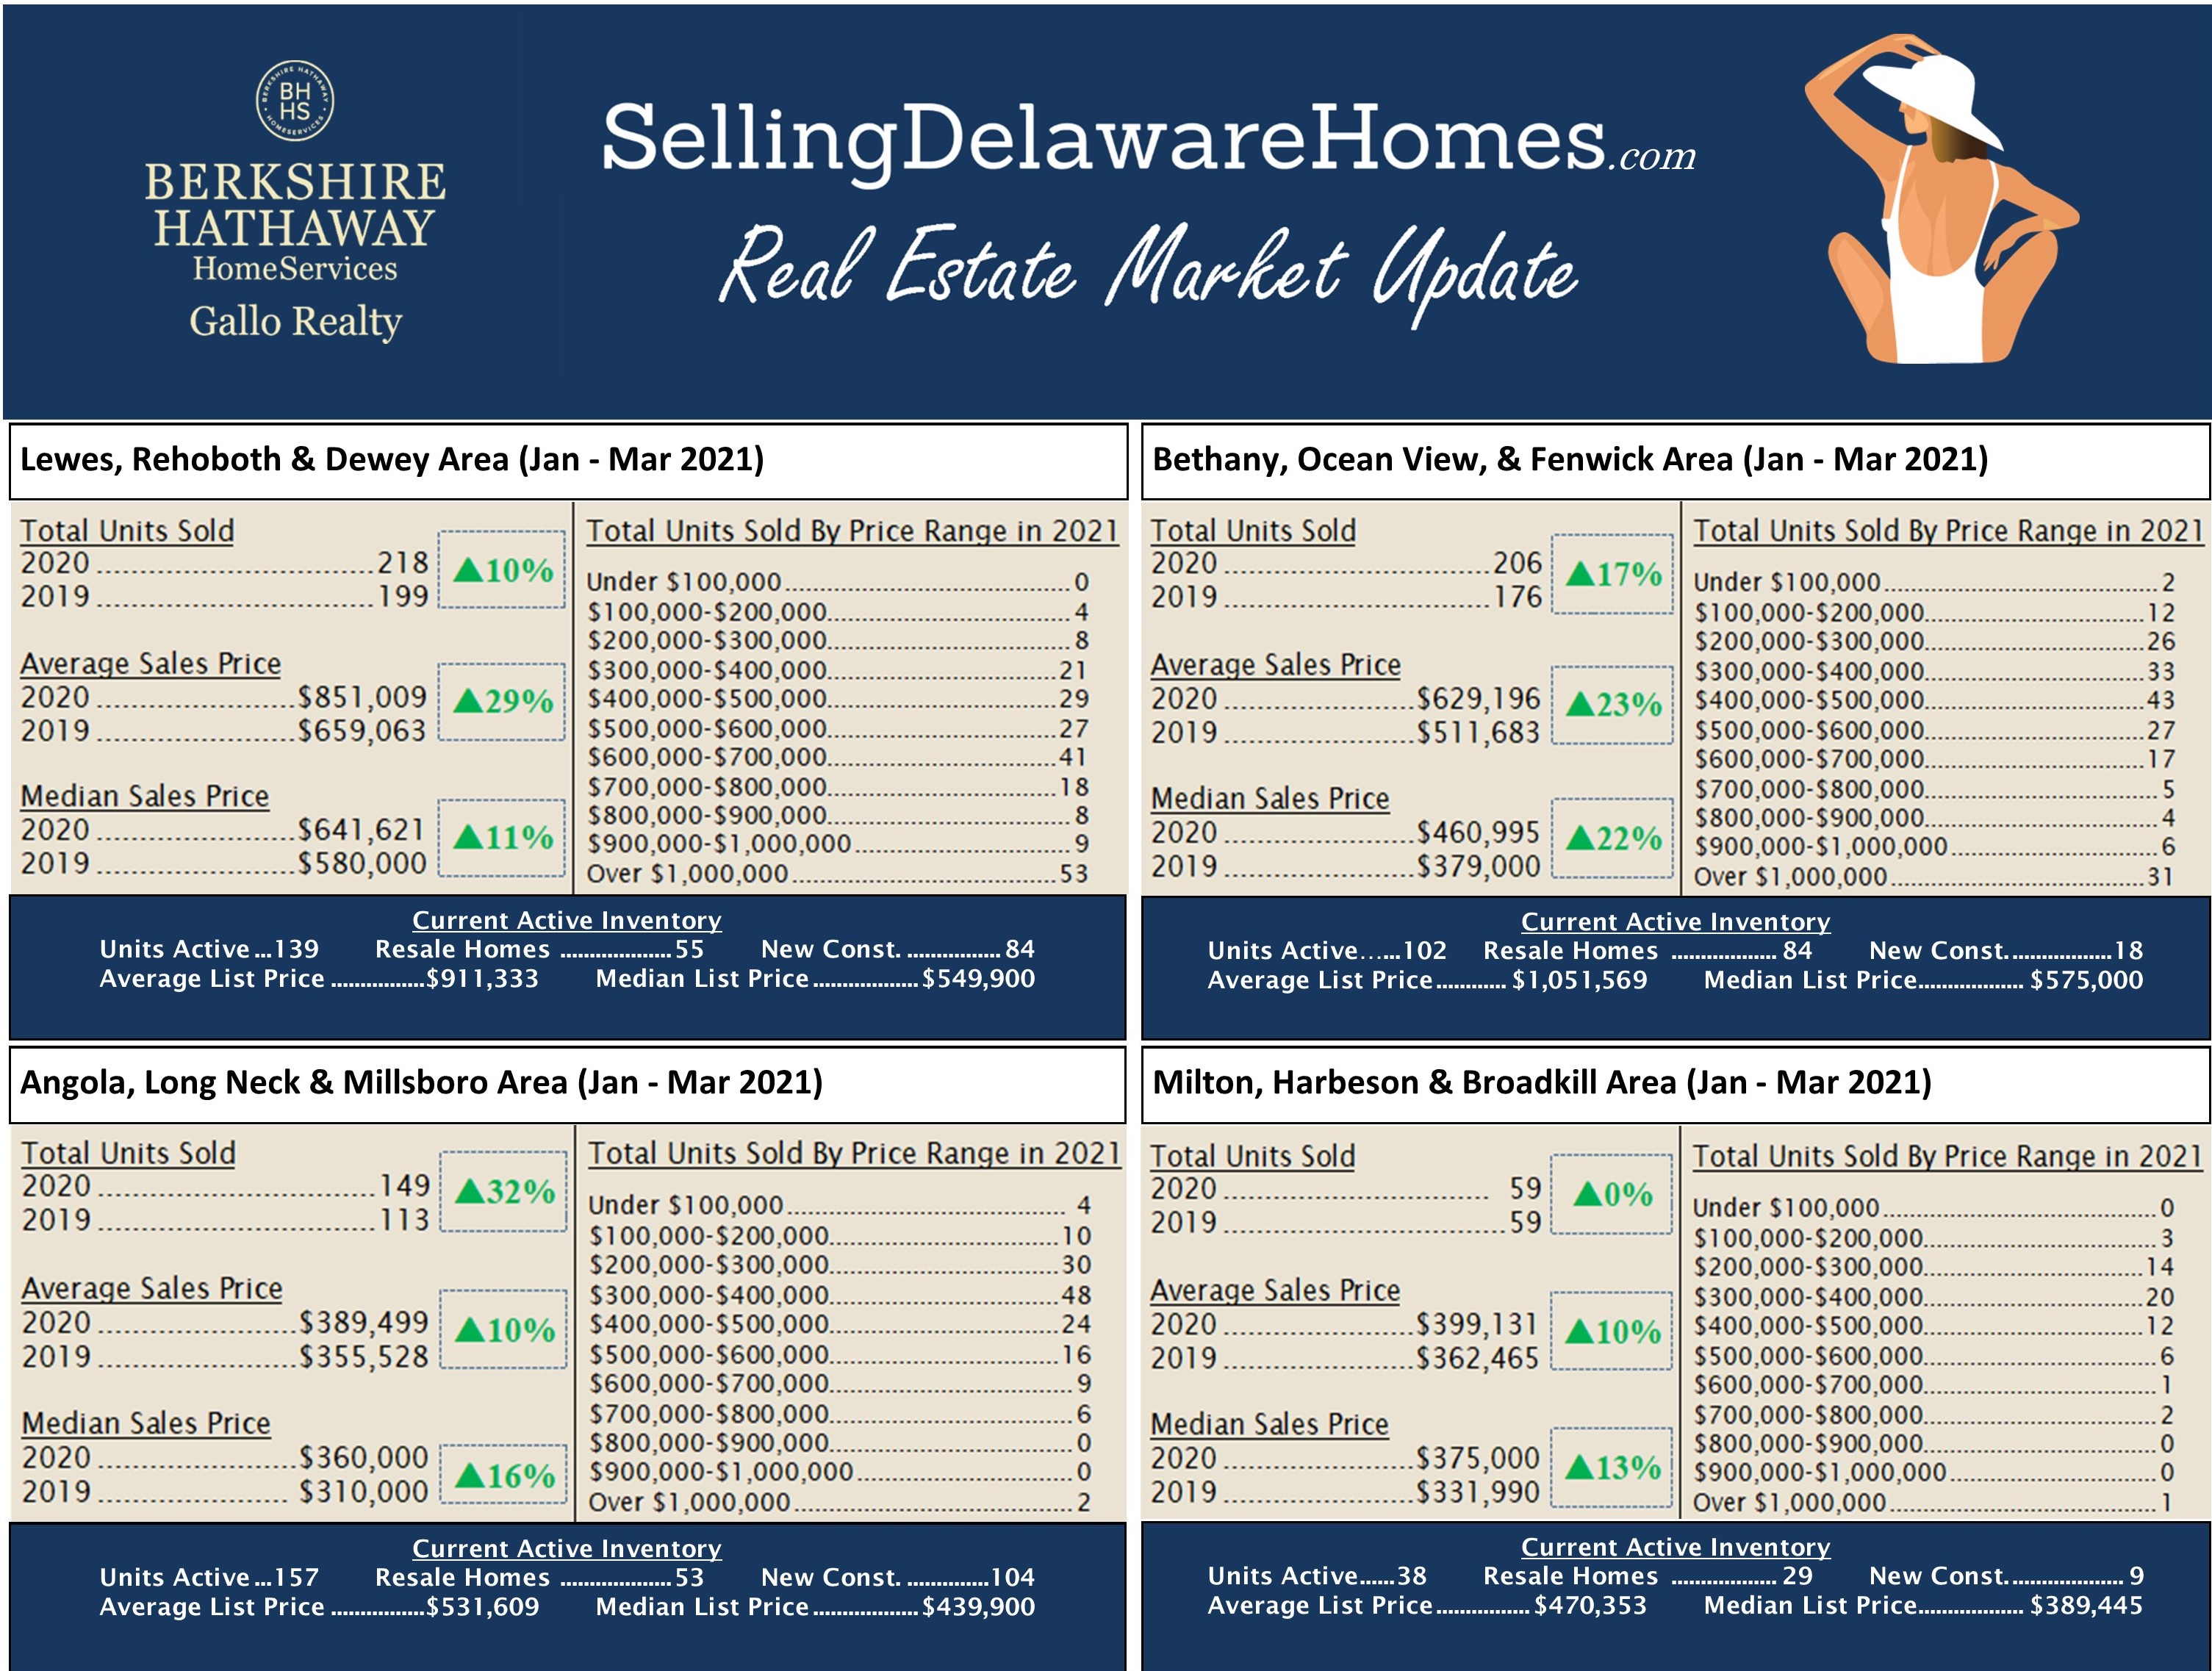
For the first three months of 2021, sales of single-family homes in Sussex County are up 13% from last year, with 995 homes sold compared to 877 for the first three months of 2020. The areas with the largest increase were the Georgetown Area, up 71% and the Angola/Long Neck/Millsboro Area, up 32%. The areas with the largest decrease are the Milford/Lincoln/Slaughter Beach Area, down 19% and the Dagsboro/Millsboro Area, down 2% from last year to date.
Home Prices
The average sales price of single-family homes in Sussex County are up over the first 3-month period of last year, $494,189 compared to $411,567, a 20% increase. The median sales price was also up over the first 3-months of 2020, $362,490 compared to $320,000, a 13% increase.
Pending Sales
Pending sales for the first three months of 2021 were up by 22% over last year, with 1,188 homes going under contract through March of 2021, compared to 976 in 2020.
Days on Market
The average days on market for homes to go under contract has decreased by 36% for homes sold through March of this year compared to last. In 2021, the current average days on market is 57 days, compared to 89 days through March of 2020.
**The statistics referenced here are based on detached single family homes, derived from the Bright Multiple Listing Service.

